New Local Plan: Spatial Options Document 2021
Strategy Options
Hierarchy of Settlements
In developing options for the strategy of the plan, it is considered helpful to categorise settlements in a hierarchy in a way that reflects their relative role and contribution to Rochford as a district. Our settlement hierarchy needs to reflect a range of different factors, including population, geographical size, availability and range of services and transport accessibility.
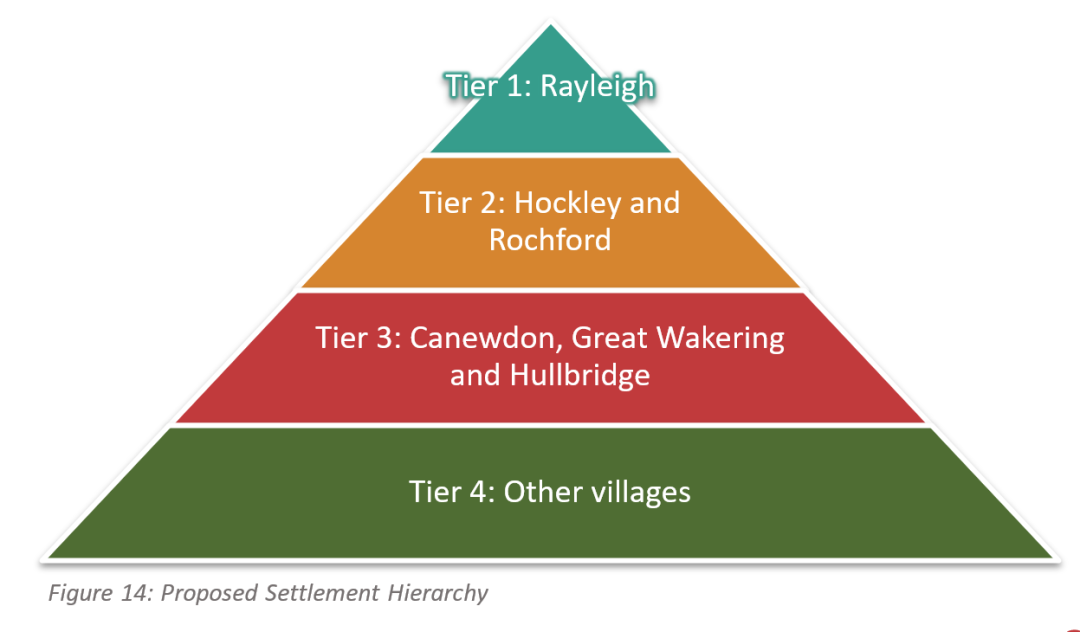
We commissioned a Settlement Role and Hierarchy Study (2021) to consider the individual roles of different settlements in Rochford and how best to categorise these for the purposes of planning. Our recommended settlement hierarchy is presented at Figure 14.
- Tier 1 comprises our largest town of Rayleigh. Rayleigh has a significantly larger population (34,000 people) than any other settlement in Rochford, and contains by far the widest range of local and regional services, including two secondary schools, a large town centre, and a generous range of retail, employment and community facilities.
- Tier 2 comprises our larger settlements of Hockley (including Hawkwell) and Rochford (including Ashingdon). These settlements have populations in the range of 10,000 – 25,000 people and contain a good range of local services, including a secondary school, modest-sized town centres, and a good range of retail, employment and community facilities.
- Tier 3 comprises our larger villages of Canewdon, Great Wakering (including Little Wakering and Barling) and Hullbridge. These settlements all have populations in the range of 1,000 – 10,000 people and contain a modest range of local services, including single primary schools, small village centres and a modest range of retail, employment and community facilities. Whilst Canewdon is somewhat smaller than either Great Wakering or Hullbridge, it has a good range of facilities for a settlement of its size and benefits from a good degree of self-containment.
- Tier 4 comprises our remaining villages, including Great Stambridge, Paglesham, Rawreth, Sutton, Stonebridge and South Fambridge. These settlements all have populations smaller than 1,000 people, often considerably smaller, and typically lack most day-to-day facilities
Beyond our borders, our residents and businesses have an important relationship with Southend, Basildon, Chelmsford and London, particularly for employing and accessing regional facilities (such as hospitals, major attractions and comparison retail). These settlements are all larger than any town in Rochford and contain a much greater range of facilities. In a wider context, these settlements are likely to be equivalent to a 'Tier 0'. Other nearby towns which provide some services to Rochford residents include Wickford, which is similar in size and role to Rayleigh, and South Woodham Ferrers and Thundersley/Hadleigh, which are similar in size and role to Hockley or Rochford. Whilst these settlements are not within Rochford, and have their own growth needs, understanding the role and function of these settlements across boundaries is useful for considering the impacts of our strategy on a wider geography and vice versa.
Growth Scenarios
By 2040, Rochford needs to grow to ensure that the needs of existing and future communities can be met within our area. Failing to grow is likely to mean younger residents being forced to leave the District to find an affordable home and the District becoming less economically competitive as central government and businesses choose to invest elsewhere.
To meet our growth needs over the next 20 years, we are likely to need to plan for:
- 7,200 – 10,800 new homes of different types, sizes and tenures
- 7 – 40 hectares of new employment space of different types
- Up to 20,000 square metres of new retail space
- Transformational improvements to local road and sustainable transport networks, including long-term solutions for the A130 and A127, and working with partners to deliver an inter-urban rapid transit solution for South Essex and significant capacity improvements to existing bus and rail
- A masterplan for our town centres that encourages a more sustainable use class mix and supports their vitality in the long-term
- New local centres with accessible services
- A long-term strategy to reduce carbon usage to net zero and source energy from new renewable and low-carbon sources
- Significant new community infrastructure, including several new primary schools, at least one new secondary school and significant increases in primary care capacity
- Large areas of new open space and green infrastructure alongside strategic development sites
Planning for Housing Growth
The Government has made it clear that it wants to significantly increase the supply of new housing across the country. It has set a target of 300,000 homes to be built each year by the mid-2020s. National policy is clear that plans should meet local housing needs, unless the adverse impacts of doing so would significantly and demonstrably outweigh the benefits. When determining how many homes need to be built in Rochford, national policy is clear that the standard method set out in Government guidance should be used as a starting point, unless exceptional circumstances justify otherwise. The current standard method suggests that we would need to build around 360 homes per year over the next 20 years to meet our housing needs, which equates to 7,200 homes.
National policy also requires Local Plans to provide strategies that accommodate unmet need from neighbouring areas where it is practical to do so and is consistent with achieving
sustainable development. Whilst the scale of unmet housing need from others' plans, including those from elsewhere in South Essex and London, is not fully known, it is possible that building more than 360 homes per year, if sustainable to do so, could help to accommodate some of this need.
Our Housing and Economic Land Availability Assessment (HELAA) 2020 identifies a supply of over 4,300 homes that are already planned for. This includes existing allocations, sites with planning permission and an allowance for windfall development of around 45 homes a year. Windfall development is development which happens on sites which come forward unexpectedly and are not directly planned for in the Local Plan.
Planning for Economic and Retail Growth
The Council is part of the South Essex Economic Development Needs Assessment (EDNA) and South Essex Retail Study (SERS), both prepared in 2017. These assessments presented a range of scenarios relating to the future need for employment and retail space, respectively, over the next 20 years. It is recognised that since these assessments were prepared, the local and regional economies have been affected by the COVID-19 pandemic which is likely to have disrupted and accelerated different economic trends. Whilst updates to these assessments are planned, they are considered to remain useful for provided broad bookends for the likely need for economic uses through the new plan based on long-term trends.
The EDNA identified a potential need for up to 7 hectares of employment land by 2036, which rises to 16 hectares when making an allowance for churn and windfall. Compared against the District's potential supply of new employment land, including the delivery of allocated sites at Michelin Farm, Airport Business Park and Star Lane, it is possible that no additional land will need to be allocated to meet Rochford's future employment needs, and it may be that consolidation of employment land for housing can be justified in some locations. However, to ensure our growth strategy makes sustainable and well-rounded communities, there may remain a need to allocate land for specific or niche employment uses not being met by the existing market, such as grow-on space or flexible workhubs, which are considered in more detail in the Employment section of this paper.
The South Essex Retail Study 2017 identifies a need for around 13,000m2 of new retail floorspace by 2037, if Rochford was to build 360 homes a year over that period. This is made up of around 11,500m2 of comparison floorspace and 1,500m2 of convenience floorspace. Whilst the Retail Study does not consider the retail floorspace needs of planning for an even higher housing figure, extending this figure proportionately results in a possible need for around 20,000m2 of new retail floorspace if housing growth was around 590 homes a year.
|
Scenario |
Explanation |
|
Current Trajectory |
Approximately 4,500 new homes by 2040 can be delivered by maximising urban and brownfield capacity and windfalls. It may be possible for the remainder of Rochford’s growth needs to be met elsewhere, such as outside the Green Belt or in areas of less valuable Green Belt. However, it is a minimum expectation of national policy that local authorities plan to meet their identified needs which means this option may be unlikely to result in a sound plan if those needs cannot be met elsewhere. This scenario may also require around 7 hectares of employment land (based on EDNA combined scenario) and no new retail floorspace other than windfalls |
|
Standard Methodology |
7,200 new homes by 2040 would meet the Council's housing needs based on the current standard method This scenario may also require around 16 hectares of employment land (based on EDNA combined scenario with allowance for churn and windfall) and around 13,000 m2 of new retail floorspace (based on South Essex Retail Study) |
|
Standard Methodology + 50% Buffer |
10,800 new homes by 2040 would meet the Council's housing needs based on the current standard method, with an additional 50% buffer which could help to drive local economic growth or address unmet need from elsewhere This scenario may also require around 40 hectares of employment land (based on maintaining existing employment allocations) and around 20,000 m2 of new retail floorspace (based on Retail Study adjusted for housing growth) |
Figure 15: Growth Scenarios for the Rochford Local Plan
Why is it important to plan for the right amount of growth?
Planning for the right amount of growth is at the heart of a sustainable Plan.
Rochford District is an area with known housing challenges, many of which have been exacerbated by the Coronavirus pandemic. Our housing register has grown by 20% in the last year up to around 1,000 households and the ratio between house prices and local earnings is amongst the least affordable in the country. When new homes are built, around a third of these homes are built as affordable, typically discounted by at least 20%. By taking a positive approach to growth locally, we can help to create a more inclusive housing market, avoiding the emergence of housing-related issues including homelessness and concealed households, such as where younger people are forced to remain or return to their family home far longer than they would desire.
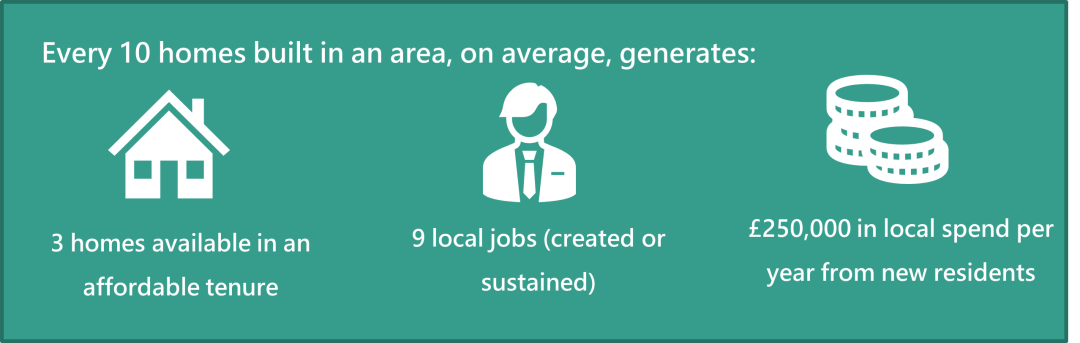
Planning for growth can also have enormous economic advantages, in terms of the local jobs created through the construction phase, the local spend created through population growth and new local premises which allow both local firms to grow and for other firms to locate in the area.
We recognise that planning for the right amount of growth is a balance, taking into account the capacity of both infrastructure and the environment. There is a clear and important relationship between the strategy within a Local Plan and the infrastructure that we can deliver, particularly as key 'big ticket' infrastructure such as transit systems, new roads or country parks would likely require funding from developments. Similarly, there is increased emphasis on development providing net gains for the environment and the planning for the right amount of growth in the right places can deliver environmental measures that secure improvements for flood risk, habitats, air quality and open spaces.
Figure 16 sets out some general assumptions about the level of growth that would be required to deliver different types of infrastructure, however the exact numbers will depend on a site-level assessment of infrastructure needs, taking into account existing infrastructure capacity.
In general, there are advantages to concentrating growth in fewer but larger areas as doing so can provide the "critical mass" needed to secure transformational new infrastructure, such as secondary schools, link roads or new transport systems.. The Government have also been clear in their funding decisions that they will help fund infrastructure where it is supporting their growth ambitions. It is also possible for this infrastructure to be funded by a number of smaller developments 'pooling together' towards common infrastructure. However, a strategy that relies on smaller sites, or sites spread more evenly through the District, may also be challenging to fund new infrastructure because developments smaller than 50 homes will typically not pay towards new infrastructure and the funds that are collected may be spread across too wide an area to be impactful.
Figure 16 – Typical Levels of Growth Required to Deliver Infrastructure
|
Type of Infrastructure |
New houses required |
|
Primary School |
1,500+ |
|
Secondary School |
4,500+ |
|
Healthcare Centre |
3,500+ |
|
Open Space (amenity / play space) |
500+ |
|
Local Centre |
1,000+ |
Standards taken from Essex County Council Developers' Guide to Infrastructure Contributions and other best practice
Spatial Strategy Options
At the heart of our new Local Plan needs to be a strategy that binds together our policies in a way that delivers the vision and objectives of our District and its individual settlements. A number of strategy options have been identified that could form the basis of the plan's approach to growth over the next 20 years and beyond.
The options identified are:
- Strategy Option 1: Urban Intensification
- Strategy Option 2: Urban Extensions
- Option 2a: Focused on main towns
- Option 2b: Dispersed to all settlements based on Settlement Hierarchy
- Strategy Option 3: Concentrated growth
- Option 3a: Focused west of Rayleigh
- Option 3b: Focused north of Southend
- Option 3c: Focused east of Rochford
- Strategy Option 4: Balanced Combination
A Strategy Option Topic Paper has been prepared to summarise how these options were identified. This Topic Paper can be found here <link>
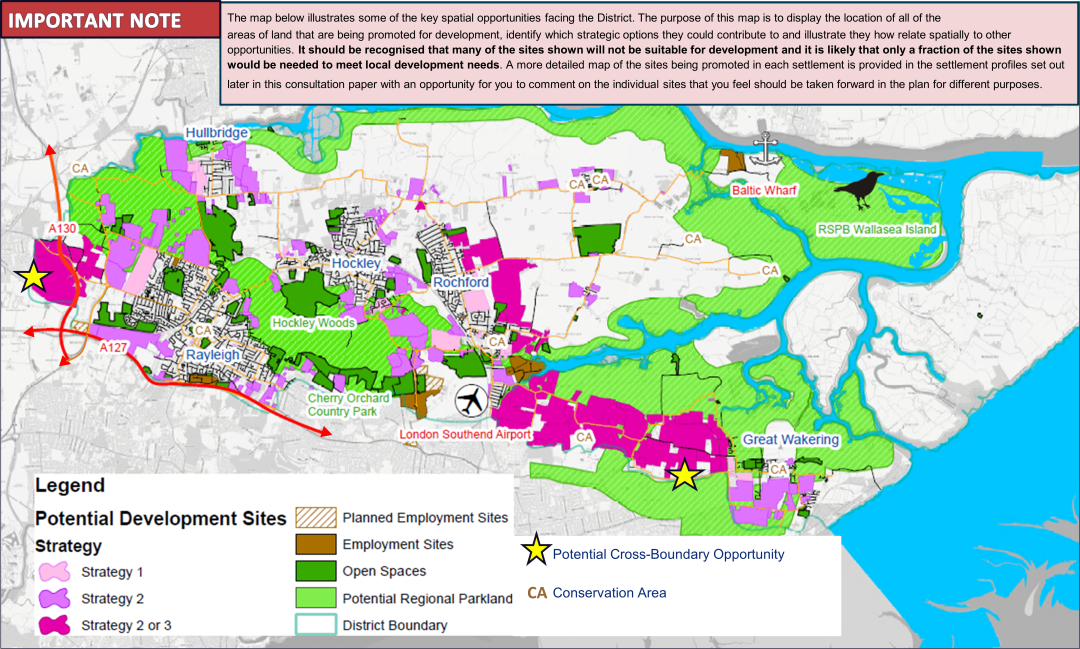
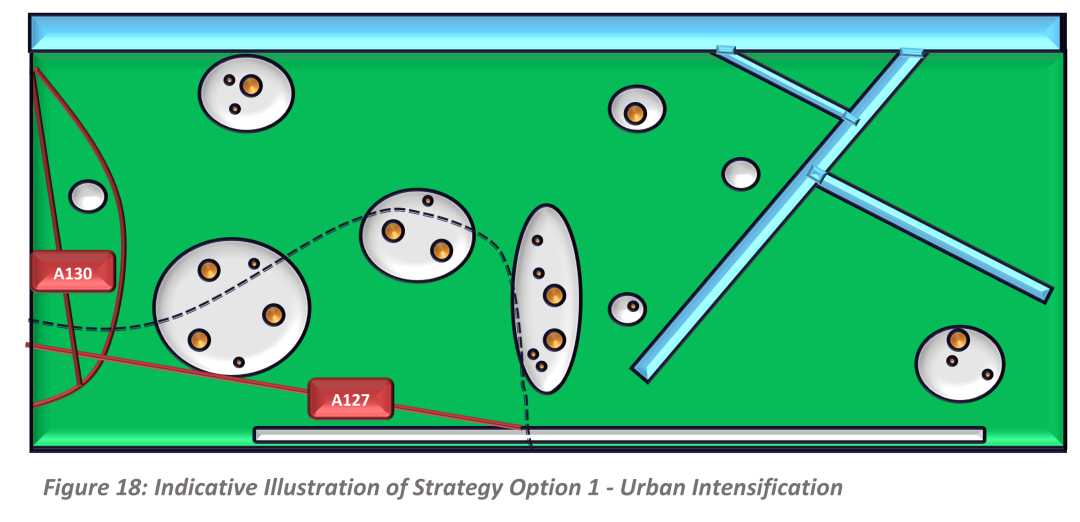
Figure 17 identifies how these strategy options relate to the sites that have been promoted for development as part of the new Local Plan, alongside other key spatial opportunities. It should be recognised that many of the sites shown will not be suitable for development and it is likely only a small percentage of the sites shown would be needed to meet local development needs.
The map below illustrates some of the key spatial opportunities facing the District. The purpose of this map is to display the location of all of the areas of land that are being promoted for development, identify which strategic options they could contribute to and illustrate they how relate spatially to other opportunities. It should be recognised that many of the sites shown will not be suitable for development and it is likely that only a fraction of the sites shown would be needed to meet local development needs. A more detailed map of the sites being promoted in each settlement is provided in the settlement profiles set out later in this consultation paper with an opportunity for you to comment on the individual sites that you feel should be taken forward in the plan for different purposes.
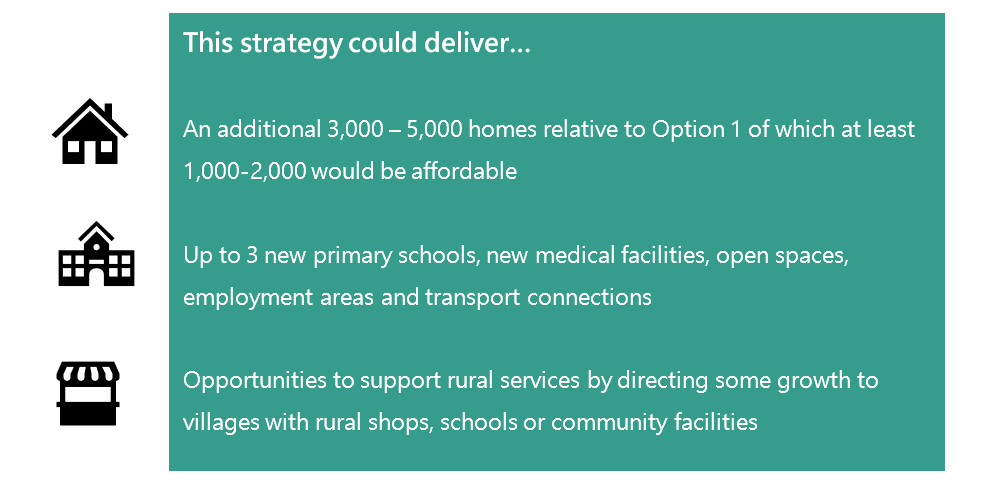
STRATEGY OPTION 1: URBAN INTENSIFICATION
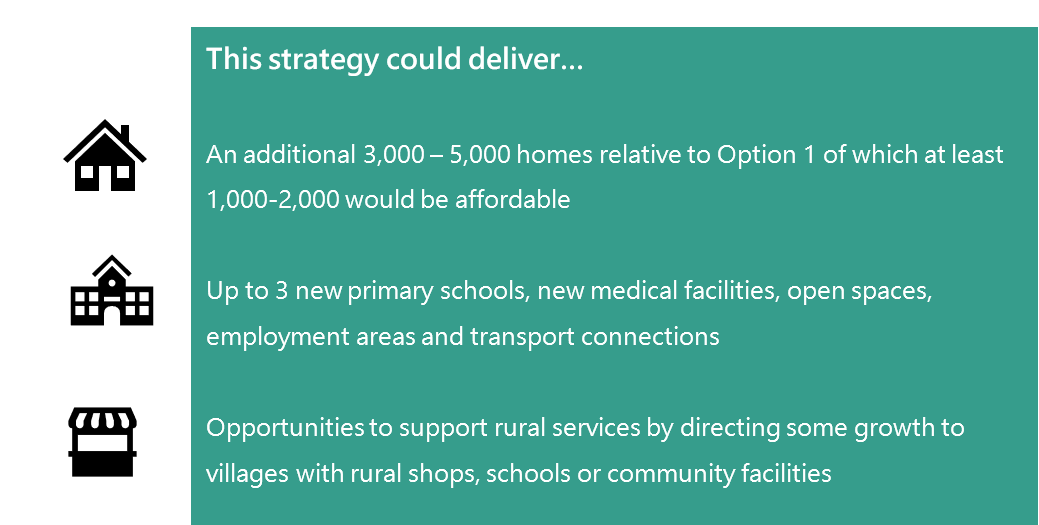
Option 1 is the minimum expectation of national policy and is likely to be required within every strategy option. This option would be to make best possible use of our existing planned developments, previously developed (brownfield) land and other under-utilised land, such as vacant buildings and contaminated land. A strategy based on urban intensification could also include taking a more permissive approach to higher densities in suitable locations (such as town centres and near stations). We expect that at least 4,200 homes will be built over the next 10 years under this option and our Urban Capacity Study suggests up to a further 1,500 homes could be built through a mixture of maximising the capacity of planned housing developments and taking a more permissive approach to higher densities in urban areas.
PROS
- This strategy requires the least use of greenfield land and, by definition, would involve no further release of land from the Metropolitan Green Belt
- This strategy makes best use of where existing services are located, including sustainable transport links and is the least dependent on the provision of new infrastructure to achieve sustainable development
- This strategy can support existing businesses and the changing role of town centres by increasing their catchment population and supporting living neighbourhoods
- This strategy can support regeneration and revival of existing areas by directing development and investment into urban areas and infrastructure, rather than the relatively more viable sites on greenfield land on the edge of settlements
CONS
- This strategy will not be able to meet our growth needs in full, which is unlikely to result in a sound plan and risks local people being unable to find or afford the home they need
- This strategy has the least scope for delivering brand new infrastructure and risks overloading existing services in urban areas
- Higher density buildings, such as flats, are relatively rare in our urban areas, particularly our historic centres, and may be damaging to local character in some places
- Urban and brownfield sites are generally less viable than greenfield sites, and therefore may be less reliable and less able to contribute towards funding infrastructure improvements
-
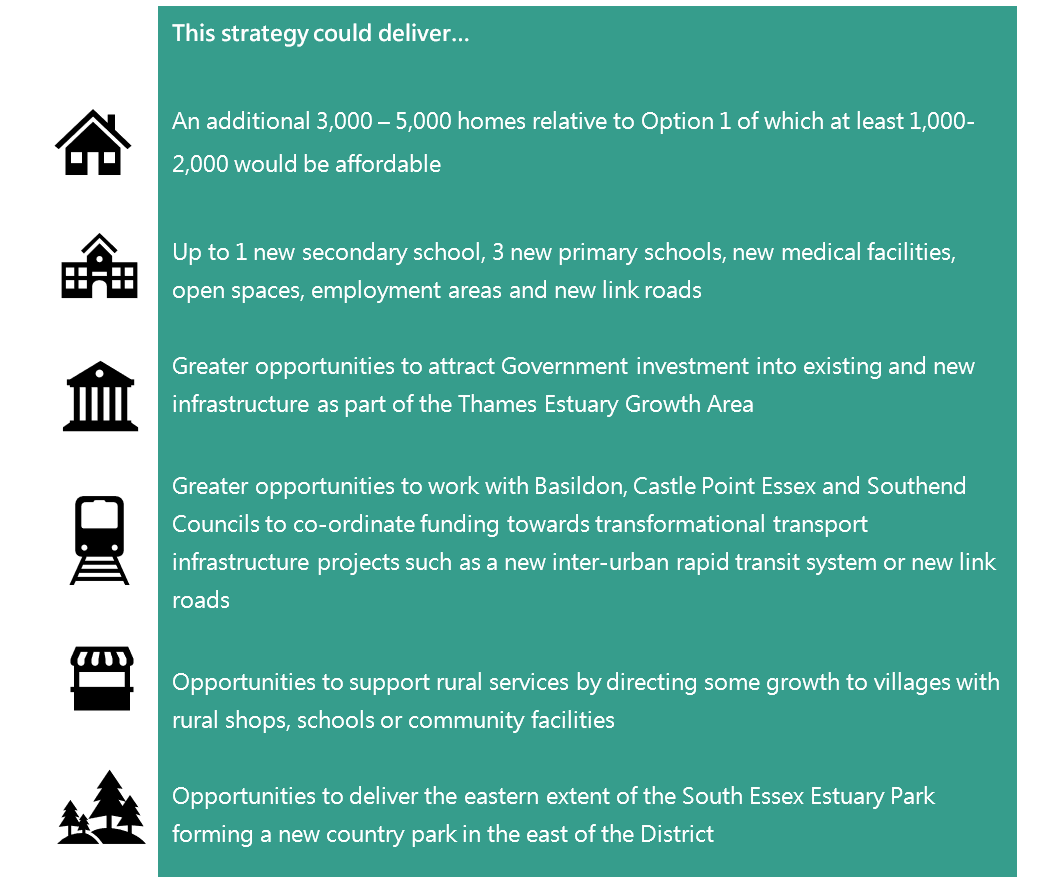
This strategy could deliver…
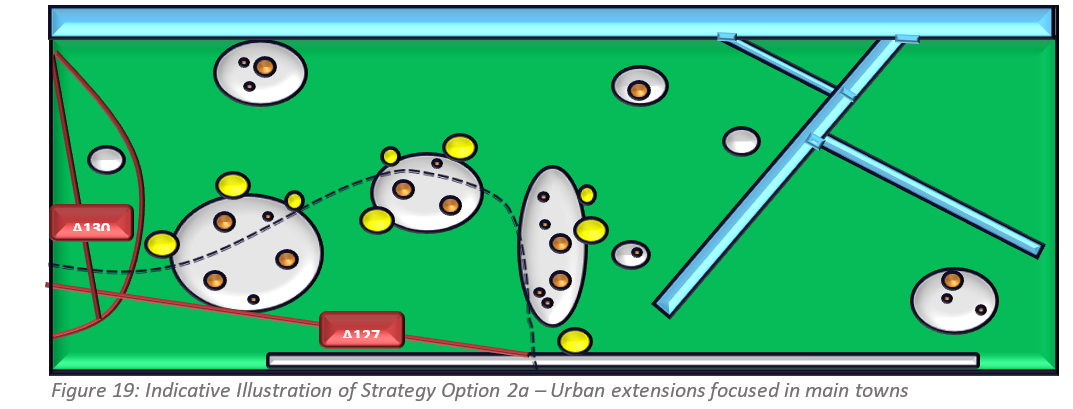
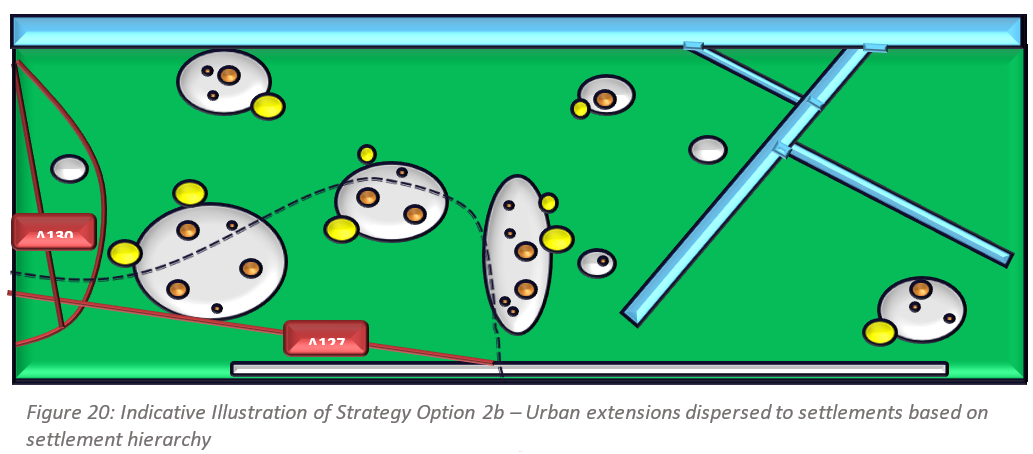
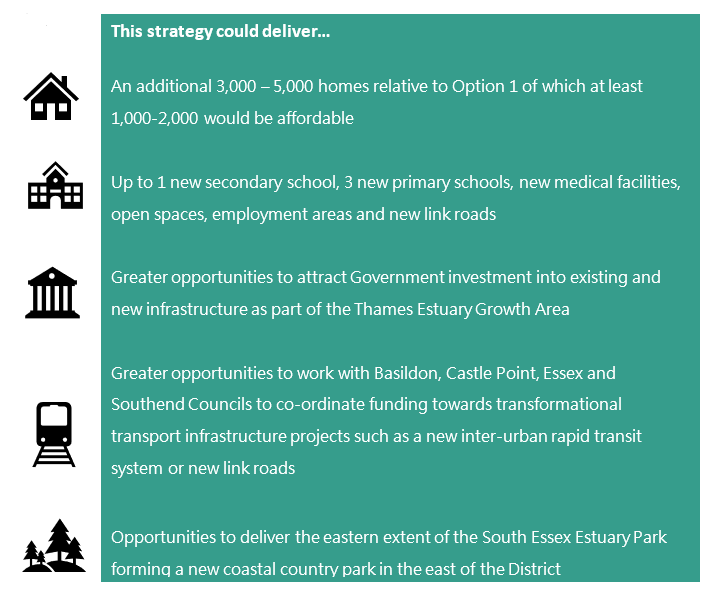
STRATEGY OPTION 2: URBAN EXTENSIONS
Option 2 would be to spread development across a number of development sites of between 10 and 1,500 homes adjoining existing towns or villages. Option 2 has two sub-options which are,
- Option 2a: Urban extensions focused in the main towns
- Option 2b: Urban extensions dispersed to settlements based on hierarchy
This option would result in a variety of site size and location. Larger development sites could need to deliver their own services such as open spaces, shops and basic medical facilities. Smaller sites may need to pool together to deliver new infrastructure.
PROS
- Through larger sites and effective co-ordination of smaller sites, this strategy would have a reasonable 'critical mass' to be able to deliver new infrastructure in the form of primary schools, basic healthcare facilities, open spaces, shops and other community facilities
- This strategy provides an opportunity for smaller local developers to contribute to meeting local housing needs, spreading the risk of housing supply across a number of builders and containing more of the economic benefits of growth locally
- By involving a greater number of developers and site, this strategy may deliver more quickly and generate more diversity both in terms of design and uses
- This strategy is relatively more likely to be able to attract external investment into new infrastructure and community facilities than Strategy Option 1
CONS
- This strategy may be relatively less able to deliver transformational new infrastructure, such as link roads, new bus routes or secondary schools, as there may be insufficient growth in one area to co-ordinate the necessary funding
- This strategy may create a cumulative population increase that it is more challenging to support with new infrastructure given the population growth would be spread across a wider area and relying on a greater number of sites, adding complexity and risk
- This strategy would involve significantly growing some existing settlements to a scale that may change their character and function in a way that existing residents do not agree with
- This strategy would require release of Green Belt land across a number of locations which may be more noticeable and harder to mitigate
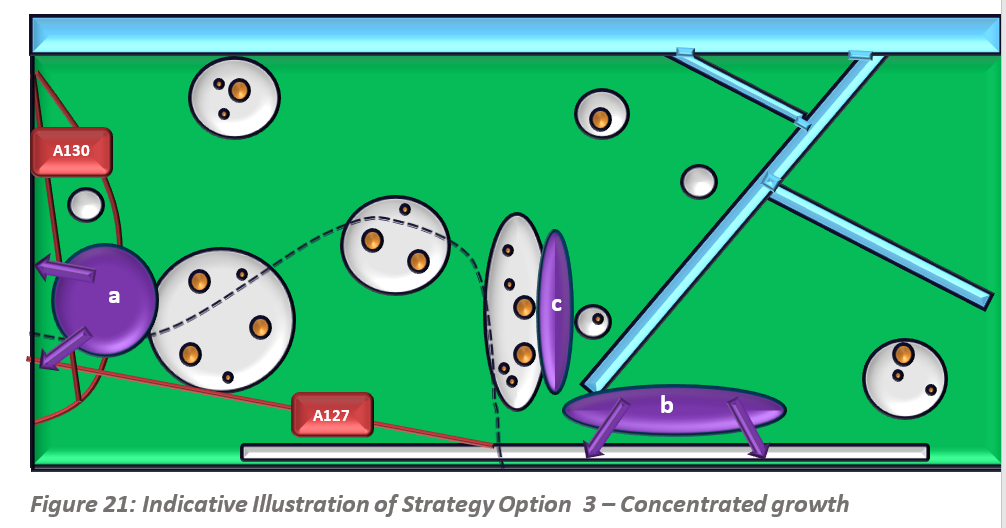
STRATEGY OPTION 3: CONCENTRATED GROWTH
Option 3 would be to concentrate growth in one or more locations of 1,500+ dwellings. Option 3 has three sub-options based on locations where there is likely to be sufficient land being promoted to deliver this scale of growth in a co-ordinated way:
- Option 3a: Concentrated growth west of Rayleigh
- Option 3b: Concentrated growth north of Southend
- Option 3c: Concentrated growth east of Rochford
This option could result in a new neighbourhood the size of a large village or small town. This neighbourhood would require major new infrastructure, including at least one primary school, a range of healthcare facilities, open spaces, employment spaces and potentially its own neighbourhood centre. It may also be possible to deliver a secondary school above 4,500 dwellings.
PROS
- This strategy would provide the 'critical mass' needed to fund transformative new infrastructure, including new sustainable transport routes, link roads, schools, employment spaces and strategic green spaces, placing the least strain on existing infrastructure and services out of each of the options
- Development at this scale is more likely to attract external investment from the likes of Government to deliver strategic infrastructure improvements
- Development at this scale could deliver a series of unique neighbourhoods which are individually distinctive and which offer a diverse range of housing, jobs and characters
- There may be opportunities to deliver cross-boundary growth around Wickford (for Option 3a) and Southend (Option 3b) which could deliver even greater levels of infrastructure
CONS
- This strategy would be more complex than Options 1 or 2 and require significant work over a period of time to co-ordinate delivery across multiple landownerships and phases of development
- This strategy would place "all of our eggs in one basket" meaning if the option does not come forward as expected it could undermine the delivery of the plan
- The benefits of growth for existing communities and businesses will not be spread across the District, and this strategy could deliver relatively little in the way of infrastructure improvements within existing settlements including villages
- This strategy would require a significant redrawing of our Green Belt boundary
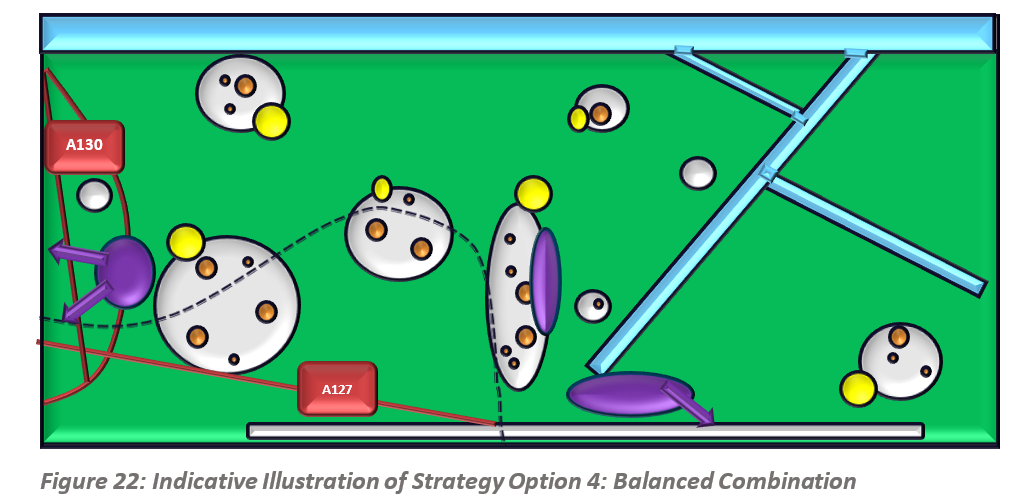
STRATEGY OPTION 4: BALANCED COMBINATION
This strategy would see a mix of the previous 3 options based on the most appropriate balance to meet development needs. This could mean making best use of urban capacity (Option 1), building one or two large growth areas (Option 3) and a number of smaller urban extensions (Option 2).
Depending on the exact combination of strategies, this option could deliver a range of major new infrastructure, including link roads, secondary school, multiple primary schools, a range of healthcare facilities, open spaces and employment spaces.
PROS
- This strategy could deliver many of the infrastructure advantages of both Option 2 and 3 by using Option 3 sites to deliver transformational new infrastructure, and directing Option 2 sites to the locations where infrastructure capacity can be most easily increased to support growth
- This strategy may spread some of the risk of maintaining a supply of housing by continuing to deliver housing prior to concentrated growth areas becoming available later in the plan period
- This strategy spreads the risk of under-delivery in Option 3 by having a more diverse mix of sites and locations
- This strategy spreads the benefits of growth across the District, including to where growth is needed to sustain existing services (such as rural shops and primary schools) or provide new services (such as new public transport)
CONS
- This strategy would remain complex and require significant co-ordination to deliver, particularly in relation to new infrastructure in locations where multiple sites are expected to contribute to funding this
- This strategy retains some of the risk of Option 3 should larger growth areas still be relied upon to deliver a significant proportion of development needs
- This strategy would require release of land from the Metropolitan Green Belt that would be noticeable and may require significant mitigation
- Urban extensions to existing settlements may still grow existing settlements in a way that changes their character or which places stress on existing services
In this section, each strategy option has been presented equally but with commentary relating to the overall 'pros' (opportunities) and 'cons' (challenges) that a strategy of the nature suggested is likely to face. It is recognised that each strategy performs differently against our vision and objectives and a balanced judgement of the consequences of each strategy in terms of meeting our needs for housing, jobs and infrastructure, growing and diversifying our local economy and protecting and enhancing our natural and built environments will be required when selecting a strategy.
Figure 23 sets out how the identified strategy options perform in sustainability terms as set out in the draft Integrated Impact Assessment (IIA). A full appraisal of each option is set out in the draft IIA.
Overall, Option 4 is noted by the IIA or its potential to perform better against other options in relation to the socio-economic IIA themes. This predominantly relates to the flexibility provided in a tailored approach, essentially combining the best performing aspects of each individual approach (urban intensification, urban extensions and concentrated growth). The potential for significant negative effects has been identified under all options except for Option 1, this is due to likely loss of high-quality soil resources and encroachment on the countryside as well as potential landscape impacts. Significant positive effects are considered likely for all options except for Option 1, this relates to significant delivery of new homes and supporting infrastructure, including new open spaces, to support a growing population, meeting housing needs in full (whilst risks are associated with concentrated growth options) and delivering new employment areas. Uncertain effects have also been identified across the IIA themes, relating to the uncertainty of housing supply under some options and the potential accessibility of some locations and reflecting the need to understand more precise locations of development as the new Local Plan develops.
|
Option 1 |
Option 2a |
Option 2b |
Option 3a |
Option 3b |
Option 3c |
Option 4 |
||
|
Population and communities |
Rank |
4 |
3 |
2 |
4 |
4 |
4 |
1 |
|
Significant effect? |
Uncertain |
Yes - Positive |
Yes - Positive |
Uncertain |
Uncertain |
Uncertain |
Yes - Positive |
|
|
Health and wellbeing |
Rank |
3 |
2 |
2 |
1 |
1 |
1 |
1 |
|
Significant effect? |
No |
Yes - Positive |
Yes - Positive |
Yes - Positive |
Yes - Positive |
Yes - Positive |
Yes - Positive |
|
|
Equality, diversity and inclusion |
Rank |
2 |
2 |
2 |
2 |
2 |
2 |
1 |
|
Significant effect? |
Uncertain |
Uncertain |
Uncertain |
Uncertain |
Uncertain |
Uncertain |
Yes - Positive |
|
|
Economy |
Rank |
4 |
3 |
3 |
2 |
2 |
2 |
1 |
|
Significant effect? |
No |
No |
No |
Yes - Positive |
Yes - Positive |
Yes - Positive |
Yes - Positive |
|
|
Transport and movement |
Rank |
3 |
2 |
3 |
1 |
1 |
1 |
1 |
|
Significant effect? |
No |
Uncertain |
Uncertain |
Yes - Positive |
Yes - Positive |
Yes - Positive |
Yes - Positive |
|
|
Landscape |
Rank |
1 |
3 |
4 |
2 |
5 |
5 |
2 |
|
Significant effect? |
No |
Uncertain |
Uncertain |
Uncertain |
Yes - Negative |
Yes - Negative |
Uncertain |
|
|
Historic environment |
Rank |
= |
= |
= |
= |
= |
= |
= |
|
Significant effect? |
Uncertain |
Uncertain |
Uncertain |
Uncertain |
Uncertain |
Uncertain |
Uncertain |
|
|
Climate change |
Rank |
2 |
1 |
1 |
1 |
1 |
1 |
1 |
|
Significant effect? |
No |
No |
No |
No |
No |
No |
No |
|
|
Biodiversity |
Rank |
1 |
3 |
3 |
2 |
2 |
2 |
2 |
|
Significant effect? |
No |
Uncertain |
Uncertain |
Uncertain |
Uncertain |
Uncertain |
Uncertain |
|
|
Environmental quality |
Rank |
1 |
2 |
2 |
3 |
3 |
3 |
3 |
|
Significant effect? |
No |
Uncertain |
Uncertain |
Yes - Negative |
Yes - Negative |
Yes - Negative |
Yes - Negative |
|
|
Natural resources |
Rank |
1 |
4 |
4 |
3 |
3 |
3 |
2 |
|
Significant effect? |
No |
Yes - Negative |
Yes - Negative |
Yes - Negative |
Yes - Negative |
Yes - Negative |
Yes - Negative |
|
Figure 23: Sustainability Appraisal of Strategy Options (AECOM, 2021)
(85) Q7. Are there any reasonable alternatives to these options that should be considered instead? [Please state reasoning]