Playing Pitch Strategy SPD
Chapter 4 - Supply and Demand for Pitches
(1) Supply: playing pitch provision in Rochford District
4.1 Using both desktop review (including information drawn from Active Places, Essex County Football Association Handbook and fixtures on different sports league websites) and the results from the questionnaire, 85 playing pitches were identified in the District. This figure includes all known public, private, school and other pitches whether or not they are in secured public use.
These comprise of:
-
54 adult football pitches
-
Four junior football pitches
-
17 mini-soccer pitches
-
Seven cricket pitches
-
Two adult rugby union pitches
-
One grass hockey pitch
Quality
4.2 In order to provide a balanced and informative evaluation of playing pitches within the District, a qualitative element is included within the strategy to counteract the predominant quantitative leanings, and aid effective decision-making.
4.3 As suggested within the Sport England guidance, a qualitative aspect was included within the questionnaire to assemble both providers and users views of playing pitches within Rochford District.
4.4 In addition, on-site pitch quality assessment was carried as part of the Open Space Study (2010). They have been rated according to their quality ranging from ‘very poor’ to ‘very good’ condition based on quality definitions which can be found in Appendix E and Appendix F of the Study. These results should be read in conjunction with the findings from the questionnaire survey.
4.5 Figure 4.1 shows the perception of the quality of the football pitches within the District according to participants who responded to the questionnaire.
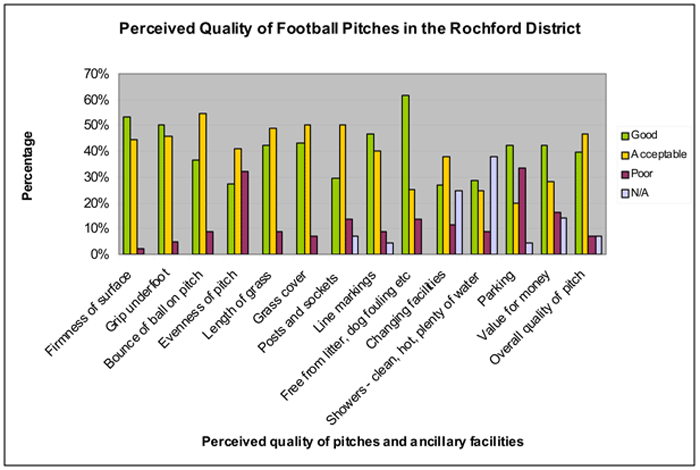
4.6 Perceived quality of pitches (and ancillary facilities) is almost as important as actual quality as it can heavily influence the pattern of play. Perceived quality of pitches was examined primarily from a user’s perspective. Questionnaires were sent out to all sports clubs and schools in Rochford District which asked for their perceptions of pitch quality. Comments and figures discussed below are therefore based primarily on the returned questionnaires only.
4.7 In general, there are relatively high levels of satisfaction with football pitches and ancillary facilities amongst users within the District.
4.8 Over 85% respondents felt that the overall quality of the pitches were average or better.
4.9 The highest rated quality factors of pitches were free from litter, dog fouling etc, firmness of surfaces and grip underfoot.
4.10 However, about one third of the respondents indicated that the evenness of the playing pitches and parking provision are poor.
4.11 Another relatively high level of dissatisfaction was value for money, 16% of the respondents rated this aspect as poor.
4.12 In terms of other sports, no questionnaire response was received from any rugby clubs; only one questionnaire has been received from a hockey club, and responses from two cricket clubs.
4.13 Due to the poor response rate and the small sample size, the perceived quality of rugby, hockey and cricket pitches will not be recorded in the assessment.
(1) Pitches secured for community use
4.14 It is important that playing pitches are available for community use. The following categorisation as defined by Sport England seeks to indicate which pitches should, and should not, be included within this assessment
4.15 Secured community pitches can be defined and categorised as:
-
pitches under local authority or other public ownership or management – A(i)
-
pitches in the voluntary, private or commercial sector which are open to members of the public – A(ii)
-
pitches at education sites which are available for use by the public through formal community use arrangements – A(iii)
4.16 Pitches which are used by the community, but are not secured for use include school/college pitches without formal user agreements (Category B).
4.17 Pitches located at establishments which are not, as a matter of policy or practice, available for hire by the public, are not open for public use (Category C).
4.18 Table 4.1 shows the quantity of outdoor playing fields within the District which are available for community use.
4.19 Of the 37 playing fields identified, 32 (86.49%) of them are secured for the local community use (Category A). This percentage is extremely high in comparison to some other authorities (see Table 4.2 below) from which data is available.
Table 4.1 – Categories of Outdoor Playing Fields
| A(i) | A(ii) | A(iii) | B | Total | |
|---|---|---|---|---|---|
| Football |
|
|
|
|
|
| Cricket |
|
|
|
|
|
| Rugby |
|
|
|
|
|
| Hockey |
|
|
|
|
|
Table 4.2 – Pitches with secured community use 13
| Local Authority | % of pitches secured for community use |
|---|---|
| Rochford District Council | 86.49% |
| Ipswich Borough Council | 84% |
| Maidstone Borough Council | 61% |
| Chelmsford Borough Council | 61% |
| Canterbury City Council | 50% |
| St Albans City and District Council | 49% |
Demand: sport clubs in Rochford District
4.20 The assessment looked at the supply of the playing pitches which are available for community use from the last section. However, even there is a high supply of playing pitches, there could still be shortfall for pitches if the demand is high.
4.21 In this section, the demand for playing pitches in the District is assessed using responses received from the questionnaires, in conjunction with the Playing Pitch Model (PPM).
4.22 The PPM is a tool recommended by Sport England as a numerical model that is used to:
-
Analyse the local current situation using survey data on existing teams and pitches.
-
Determine whether the current level of provision is adequate to meet the current level of demand as identified.
-
Predict future requirements for pitches by incorporating projected changes in population levels derived from the local demographic profile for the area and the most recent Strategic Housing Land Availability Assessment (previously known as Urban Capacity Study). In addition, it allows for any growth in participation that may arise as a consequence of known or anticipated local sports development activity.
4.23 Whilst the current population data was based on the 2001 census, the future active population was derived from the 2006-based subnational population projections.
Current Demand – an overview
4.24 The numbers of football, cricket, rugby and hockey teams (in real terms) playing on pitches in Rochford District in 2008/09 are identified in the table below.
Table 4.3 – Sports clubs using playing pitches in Rochford District
| Sports | Number of clubs | Number of teams |
|---|---|---|
| Football |
|
|
| Cricket |
|
|
| Rugby union |
|
|
| Hockey |
|
|
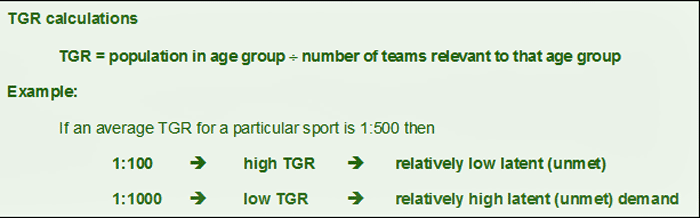
4.25 When assessing the demand, team generation rates (TGRs) was used as one of the indicators.
4.26 TGRs indicate how many people in a specified age group are required to generate one team. TGRs are derived by dividing the appropriate population age band for the relevant sport (e.g. for adult football it is the 16-45 age group) by the number of teams playing that sport. Calculating TGRs enables fair comparison to be made between different areas where similar studies have been undertaken.
4.27 The TGR calculator provided in the Sport England electronic toolkit has been used to work out the TGR of the pitch sports. Results are demonstrated in Table 4.4 – 4.7 below.
4.28 The following examples help clarify what TGR mean:
Football
4.29 When compared to other local authorities and the national average, the figures in Table 4.4 shows that the latent demand in the Rochford District for mini and adult football are relatively low. Team Generation Rates from other councils which have completed a Playing Pitch Strategy can be found in Appendix D as a point of comparison.
4.30 In contrast, there is a relatively high demand for junior football, especially for junior female teams.
Table 4.4 – A Comparison of Football Team Generation Rates
| Age Group | Rochford TGR | Chelmsford TGR | Peterborough TGR | National Average |
|---|---|---|---|---|
| Mini Soccer |
|
|
|
|
| Senior male |
|
|
|
|
| Senior female |
|
|
|
|
| Junior male |
|
|
|
|
| Junior female |
|
|
|
|
| Totals for football (excluding mini) |
|
|
|
|
Cricket
There are no women and girls cricket teams in the District. Table 4.5 shows that the latent demand for men and boys are relatively low when comparing to the national average.
Table 4.5 – A Comparison of Cricket Team Generation Rates
| Age Group | Rochford TGR | National Average TGR |
|---|---|---|
| Senior male |
|
|
| Senior female |
|
|
| Junior male |
|
|
| Junior female |
|
|
| Totals for Cricket |
|
|
Rugby
4.32 Table 4.6 illustrates that the latent demand for rugby in the District is fairly low.
Table 4.6 – A Comparison of Rugby Team Generation Rates
| Age Group | Rochford TGR | National Average TGR |
|---|---|---|
| Mini – mixed team |
|
|
| Senior male |
|
|
| Senior female |
|
|
| Junior male |
|
|
| Junior female |
|
|
| Totals for Rugby (excluding mini) |
|
|
Hockey
4.33 There is only one hockey team in Rochford District and the TGR is much higher than the national average.
4.34 This indicates that the adult participation in hockey in Rochford District is conspicuously above the national average. In other words, there seems to be latent demand for hockey in the District.
Table 4.7 – A Comparison of Hockey Team Generation Rates
| Age Group | Rochford TGR | National Average TGR |
|---|---|---|
| Senior male |
|
|
| Senior female |
|
|
| Junior male |
|
|
| Junior female |
|
|
| Totals for Hockey |
|
|
4.35 Supply and demand analysis is determined throughout the Playing Pitch Strategy at peak time usage. The PPM below summarises the surplus/deficit of pitches for each sports. Full details of the current and future PPM are included in Appendix E and F.
4.36 As shown in Table 4.8, the major issues arising from the PPM (current) are shortage of mini football pitches on Sunday AM and junior football pitches on both Sunday AM and Sunday PM.
4.37 Other sports list in the Current PPM table i.e. cricket, rugby and hockey, have demonstrated a surplus of playing pitches in the District.
4.38 Despite a surplus being identified for cricket, rugby and hockey in general terms, shortage of pitches for cricket and rugby are noted in some areas at the a more localised level.
Table 4.8 – Current PPM calculations for the District (2008/09)
| Mini-soccer | Football | Cricket | Rugby Union | Hockey | |||
|---|---|---|---|---|---|---|---|
| Stage 1: Number of teams |
|
|
|
|
|
|
|
|
|
|
|
|
|
|||
| Stage 2: Calculating home games per team per week |
|
||||||
|
|
|
|
|
|
|||
|
|
|
|
|
|
|||
| Stage 3: (S1XS2) Assessing total home games per week |
|
||||||
|
|
|
|
|
|
|||
|
|
|
|
|
|
|||
| Stage 4: Establishing temporal demand for games |
|
|
|
|
|
|
|
|
|
|
|
|
|
|||
|
|
|
|
|
|
|
|
|
|
|
|
|
|
|
|||
|
|
|
|
|
|
|
|
|
|
|
|
|
|
|
|||
|
|
|
|
|
|
|
|
|
|
|
|
|
|
|
|||
|
|
|
|
|
|
|
|
|
|
|
|
|
|
|
|||
|
|
|
|
|
|
|
|
|
|
|
|
|
|
|
|||
| Stage 5: (S3XS4) Defining pitches used/required on each day |
|
|
|
|
|
|
|
|
|
|
|
|
|
|||
|
|
|
|
|
|
|
|
|
|
|
|
|
|
|
|||
|
|
|
|
|
|
|
|
|
|
|
|
|
|
|
|||
|
|
|
|
|
|
|
|
|
|
|
|
|
|
|
|||
|
|
|
|
|
|
|
|
|
|
|
|
|
|
|
|||
|
|
|
|
|
|
|
|
|
|
|
|
|
|
|
|||
| Stage 6: Establishing pitches available |
|
|
|
|
|
|
|
|
|
|
|
|||||
| Stage 7: (S6-S5) Shortfall or surplus |
|
|
|
|
|
|
|
|
|
|
|
|
|
|||
|
|
|
|
|
|
|
|
|
|
|
|
|
|
|
|||
|
|
|
|
|
|
|
|
|
|
|
|
|
|
|
|||
|
|
|
|
|
|
|
|
|
|
|
|
|
|
|
|||
|
|
|
|
|
|
|
|
|
|
|
|
|
|
|
|||
|
|
|
|
|
|
|
|
|
|
|
|
|
|
|
|||
(1) Future Demand
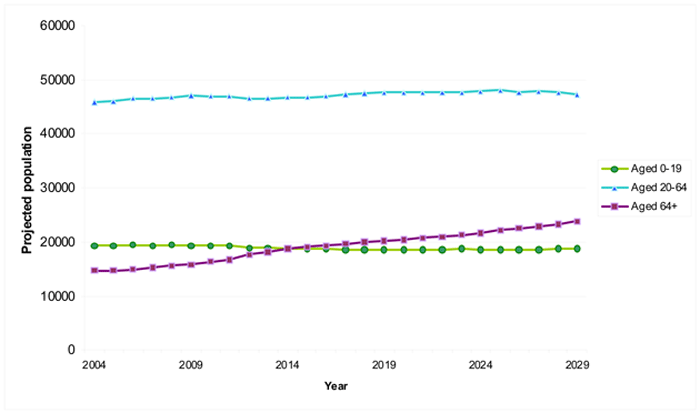
4.39 The population in the District is projected to increase to 89800 by 2021, and the demand for playing pitches would also increase. Figure 4.3 shows the projected changes in the District’s population over time by age, this shows a breakdown of the active age groups in the District up to 2029.
4.40 The PPM calculations in Table 4.9 estimate the future demand for the playing pitches in the District.
Table 4.9 – Future PPM calculations for the District (2021/22)
| Mini-soccer | Football | Cricket | Rugby Union | Hockey | |||
|---|---|---|---|---|---|---|---|
| Stage 7: (S6-S5) Shortfall or surplus |
|
|
|
|
|
|
|
|
|
|
|
|
|
|||
|
|
|
|
|
|
|
|
|
|
|
|
|
|
|
|||
|
|
|
|
|
|
|
|
|
|
|
|
|
|
|
|||
|
|
|
|
|
|
|
|
|
|
|
|
|
|
|
|||
|
|
|
|
|
|
|
|
|
|
|
|
|
|
|
|||
|
|
|
|
|
|
|
|
|
|
|
|
|
|
|
|||
4.41 The shortage for mini and junior football pitches will continue and become more significant – a deficit of 35 pitches (Sunday AM) for mini teams and a deficit of 16pitches(Sunday AM) and 38 pitches (Sunday PM) for junior teams.
4.42 Notwithstanding this, there is a significant surplus of adult football pitches during the mini and junior football peak time on Sunday. Although a surplus is required to allow for resting, renovation, development and increase in demand, this significant surplus reflects that there may be potential for some of the adult pitches to be redesignated as mini/ junior pitches to ease the pressure on these pitches.
4.43 The future demand for cricket and rugby pitches will also be in deficit on Saturdays PM and Sundays AM.
4.44 Cricket will have a deficit of about four adult pitches on Saturdays PM and three junior pitches short on Sundays AM.
4.45 When shortages will occur in both pitches for adult and junior cricket, it would be very difficult to ease the demand without providing new pitches.
4.46 Future demand for rugby is slightly higher than that for cricket. There will be a deficit of about 10 adult pitches and five junior pitches on Saturdays PM and Sundays AM, respectively.
4.47 No shortage in future demand for Hockey is recorded.
4.48 Further issues regarding quality, accessibility and recommendation will be discussed in more detail in the next chapter.
13 This data was obtained from the Playing Pitch Strategies of Chelmsford Borough Council and Darlington Borough Council published in 2005 and 2009 respectively. 14 This number represents the clubs that have teams playing in this season (2008-2009). Virtual teams are not included in the calculation. 15 Mini soccer is not included in this number.